> ## Documentation Index
> Fetch the complete documentation index at: https://docs.deflect.in/llms.txt
> Use this file to discover all available pages before exploring further.
# Analytics Dashboard
> Track chatbot performance with date filters and agent insights
The **Analytics** page gives you an overview of how your agents are performing. Use **date range** and **chatbot** filters to focus the numbers that matter, and review **Agent performance** for your team.
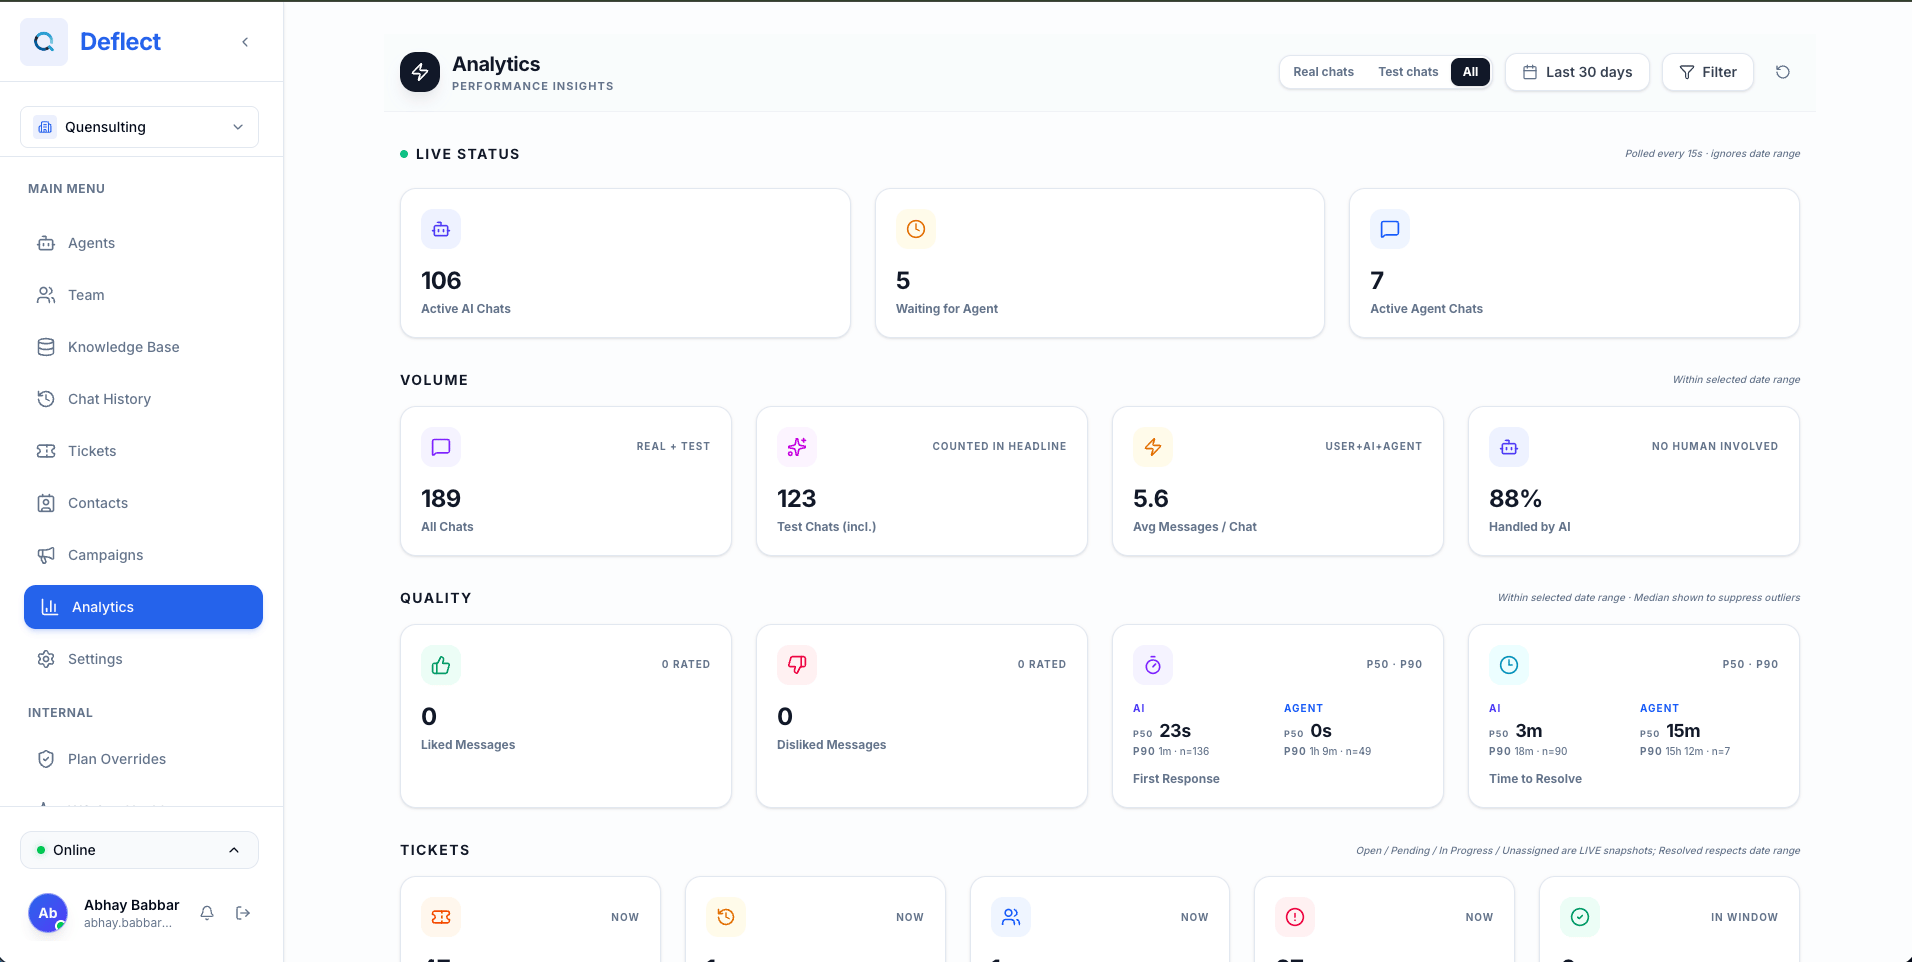 ## Navigating the dashboard
Open **Analytics** from the sidebar. The page shows your metrics for the selected period and filters, including the **Agent performance** area when available.
## Date range and filters
Use the controls at the top of the page to refine the data:
* **Date range** — Choose a preset (e.g. last 7 or 30 days) or a custom range.
* **Chatbot filter** — Limit metrics to one or more agents.
Use **Reset** to clear filters and return to the default view.
## Agent performance
The **Agent performance** section summarizes how your human agents are doing on metrics such as:
* **Conversations handled** — Live chats managed.
* **Average response time** — How quickly agents reply during live chat.
* **Resolution rate** — Share of conversations resolved.
## Navigating the dashboard
Open **Analytics** from the sidebar. The page shows your metrics for the selected period and filters, including the **Agent performance** area when available.
## Date range and filters
Use the controls at the top of the page to refine the data:
* **Date range** — Choose a preset (e.g. last 7 or 30 days) or a custom range.
* **Chatbot filter** — Limit metrics to one or more agents.
Use **Reset** to clear filters and return to the default view.
## Agent performance
The **Agent performance** section summarizes how your human agents are doing on metrics such as:
* **Conversations handled** — Live chats managed.
* **Average response time** — How quickly agents reply during live chat.
* **Resolution rate** — Share of conversations resolved.
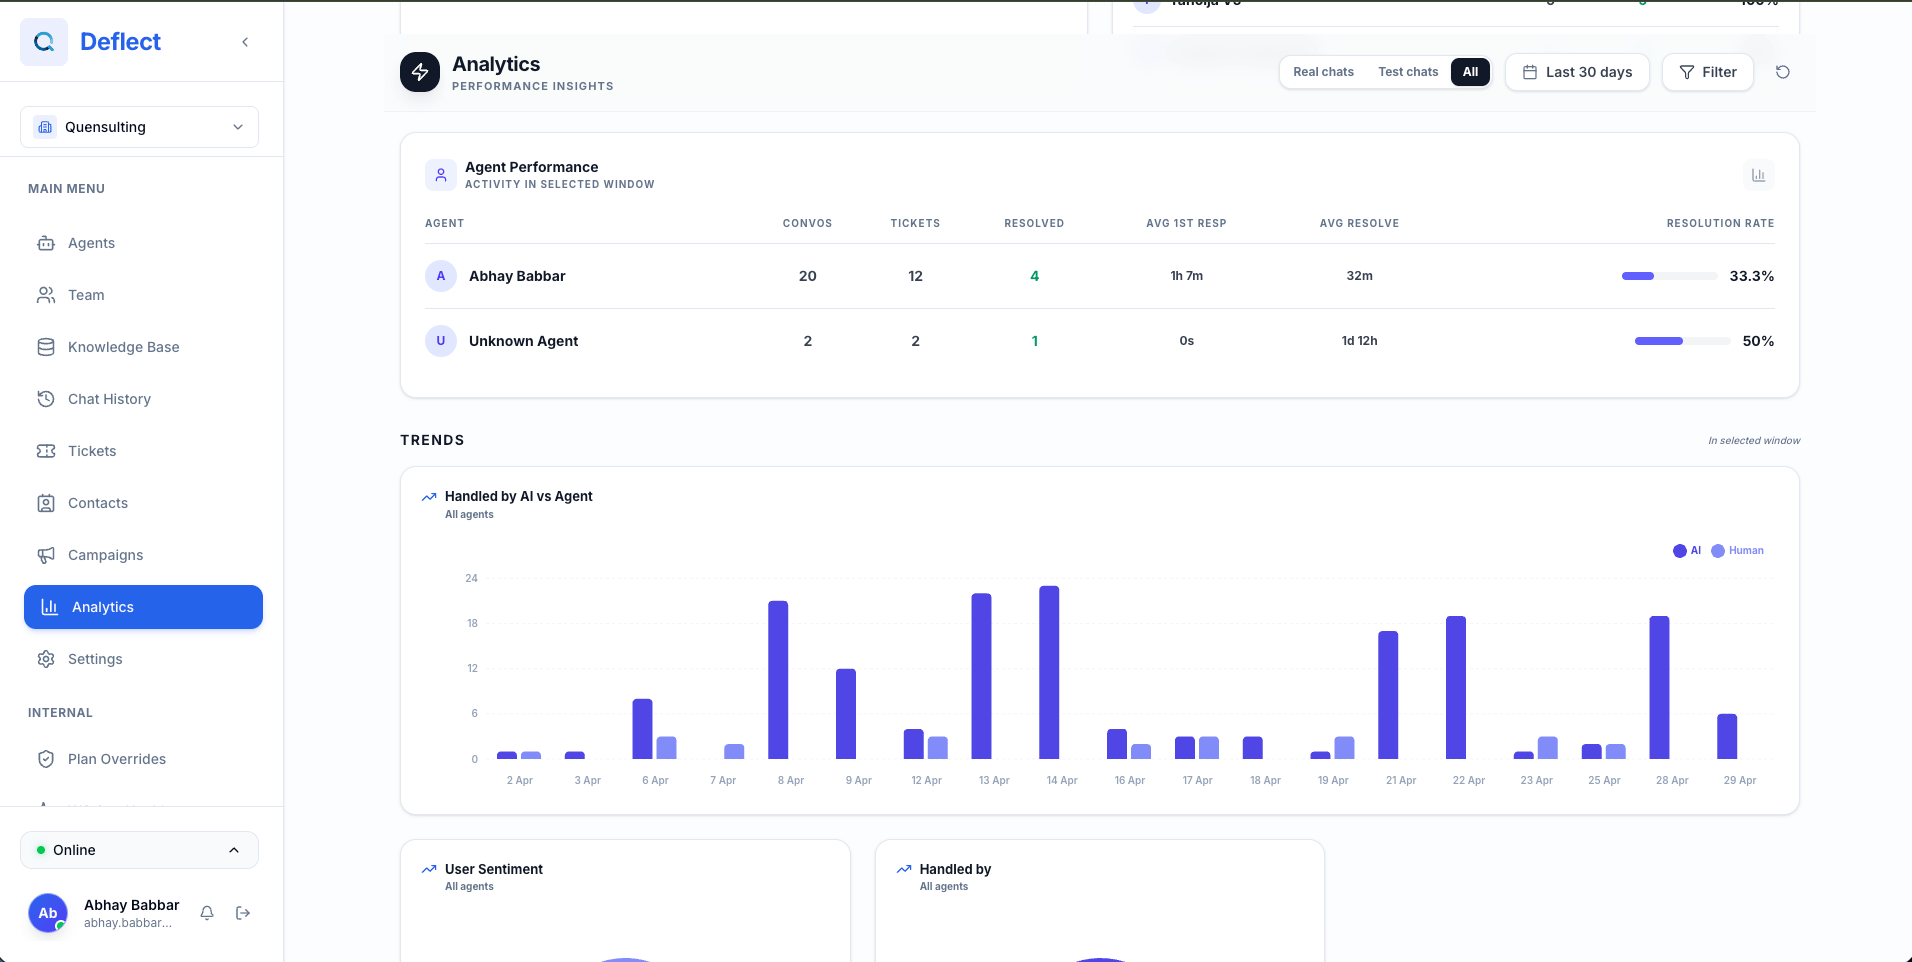 Figures refresh as new data arrives. The selected **date range** and **chatbot** filters apply across the analytics view.