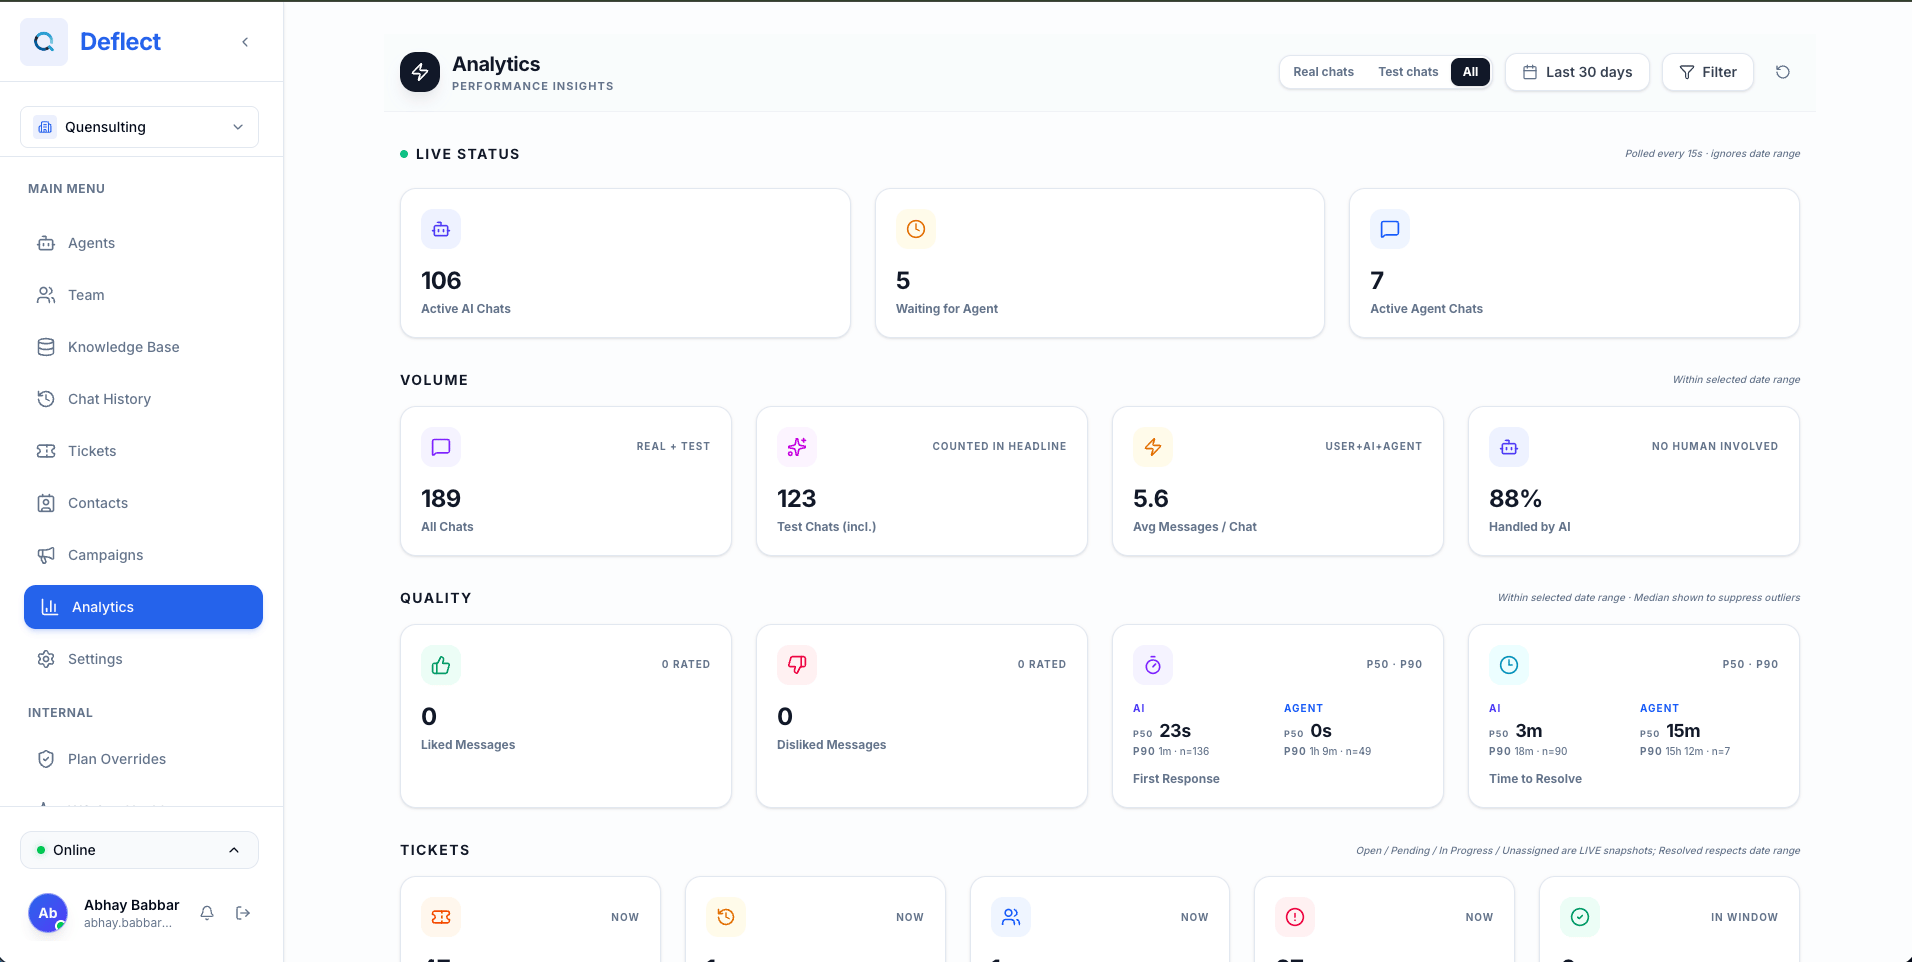
Navigating the dashboard
Open Analytics from the sidebar. The page shows your metrics for the selected period and filters, including the Agent performance area when available.Date range and filters
Use the controls at the top of the page to refine the data:- Date range — Choose a preset (e.g. last 7 or 30 days) or a custom range.
- Chatbot filter — Limit metrics to one or more agents.
Agent performance
The Agent performance section summarizes how your human agents are doing on metrics such as:- Conversations handled — Live chats managed.
- Average response time — How quickly agents reply during live chat.
- Resolution rate — Share of conversations resolved.
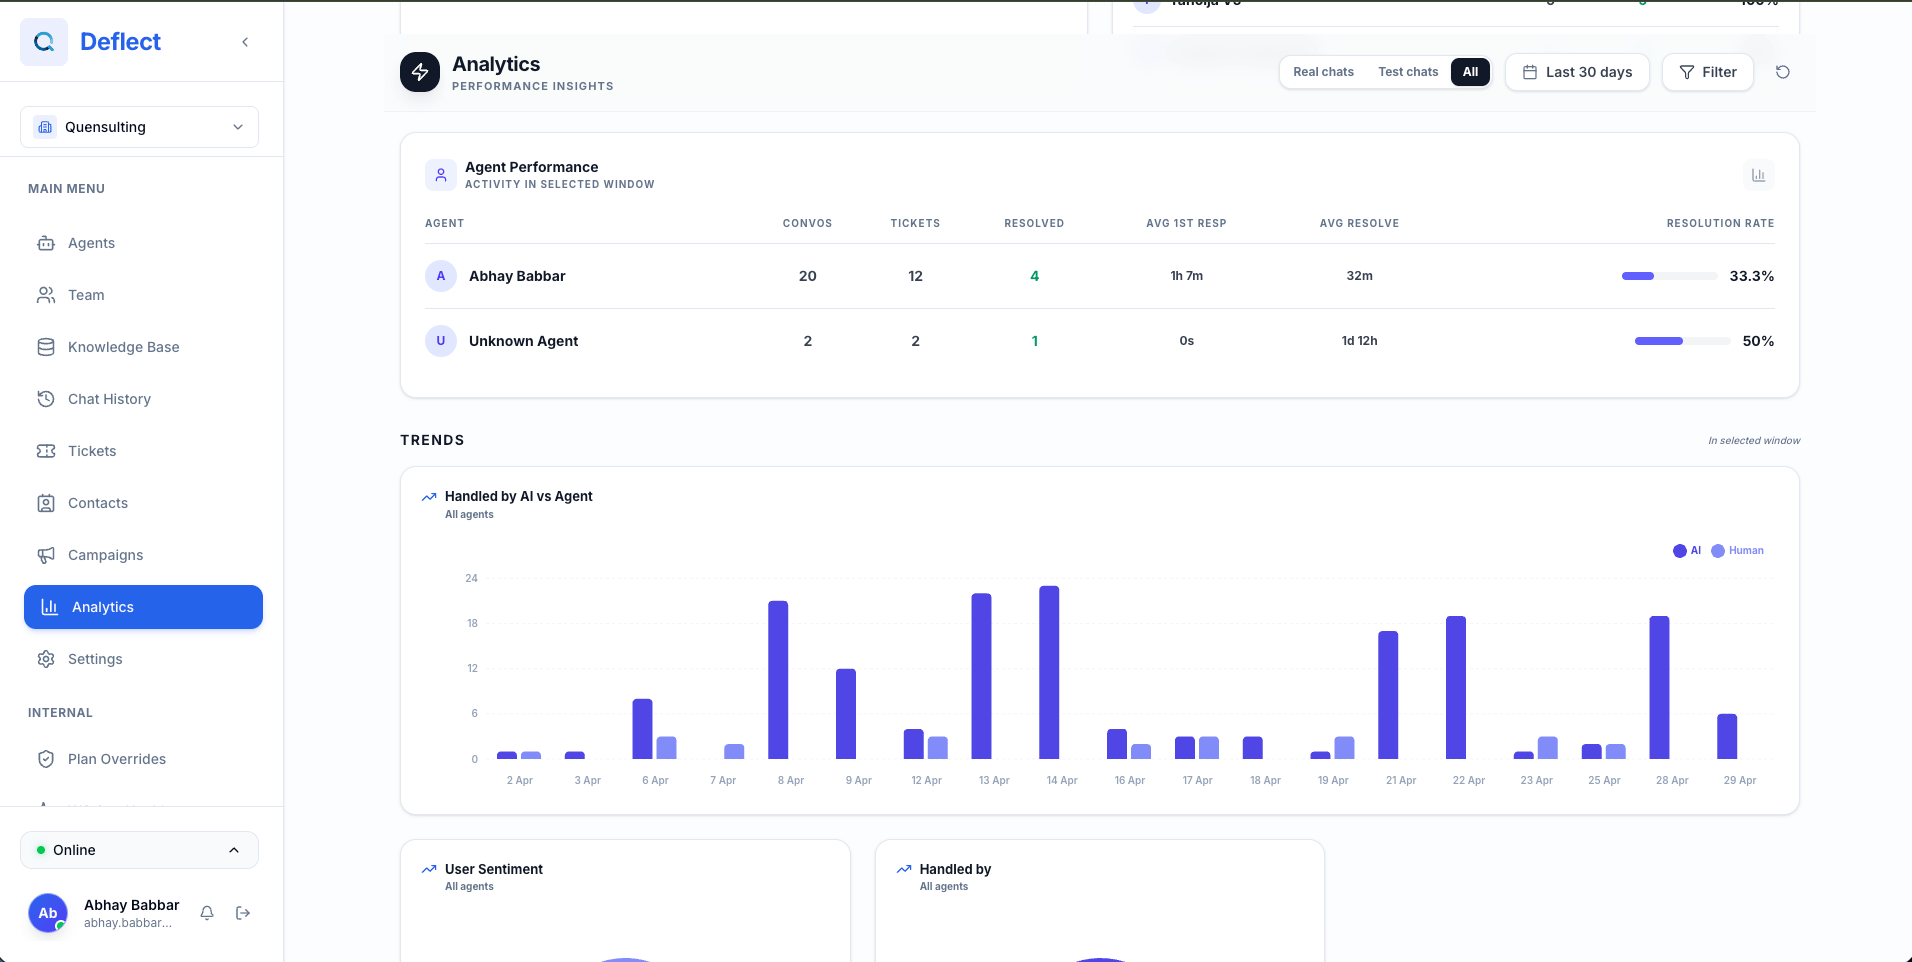
Figures refresh as new data arrives. The selected date range and chatbot filters apply across the analytics view.